Bing Still Favours Exact Match Domains Big Time
How RedirectChecker.io outranked even WhereGoes.com and ranked second - with zero link building
A data-backed SEO case study on why EMDs are far from dead - especially on Bing - and how a simple utility tool grew to 1,000+ monthly sessions from organic search alone.
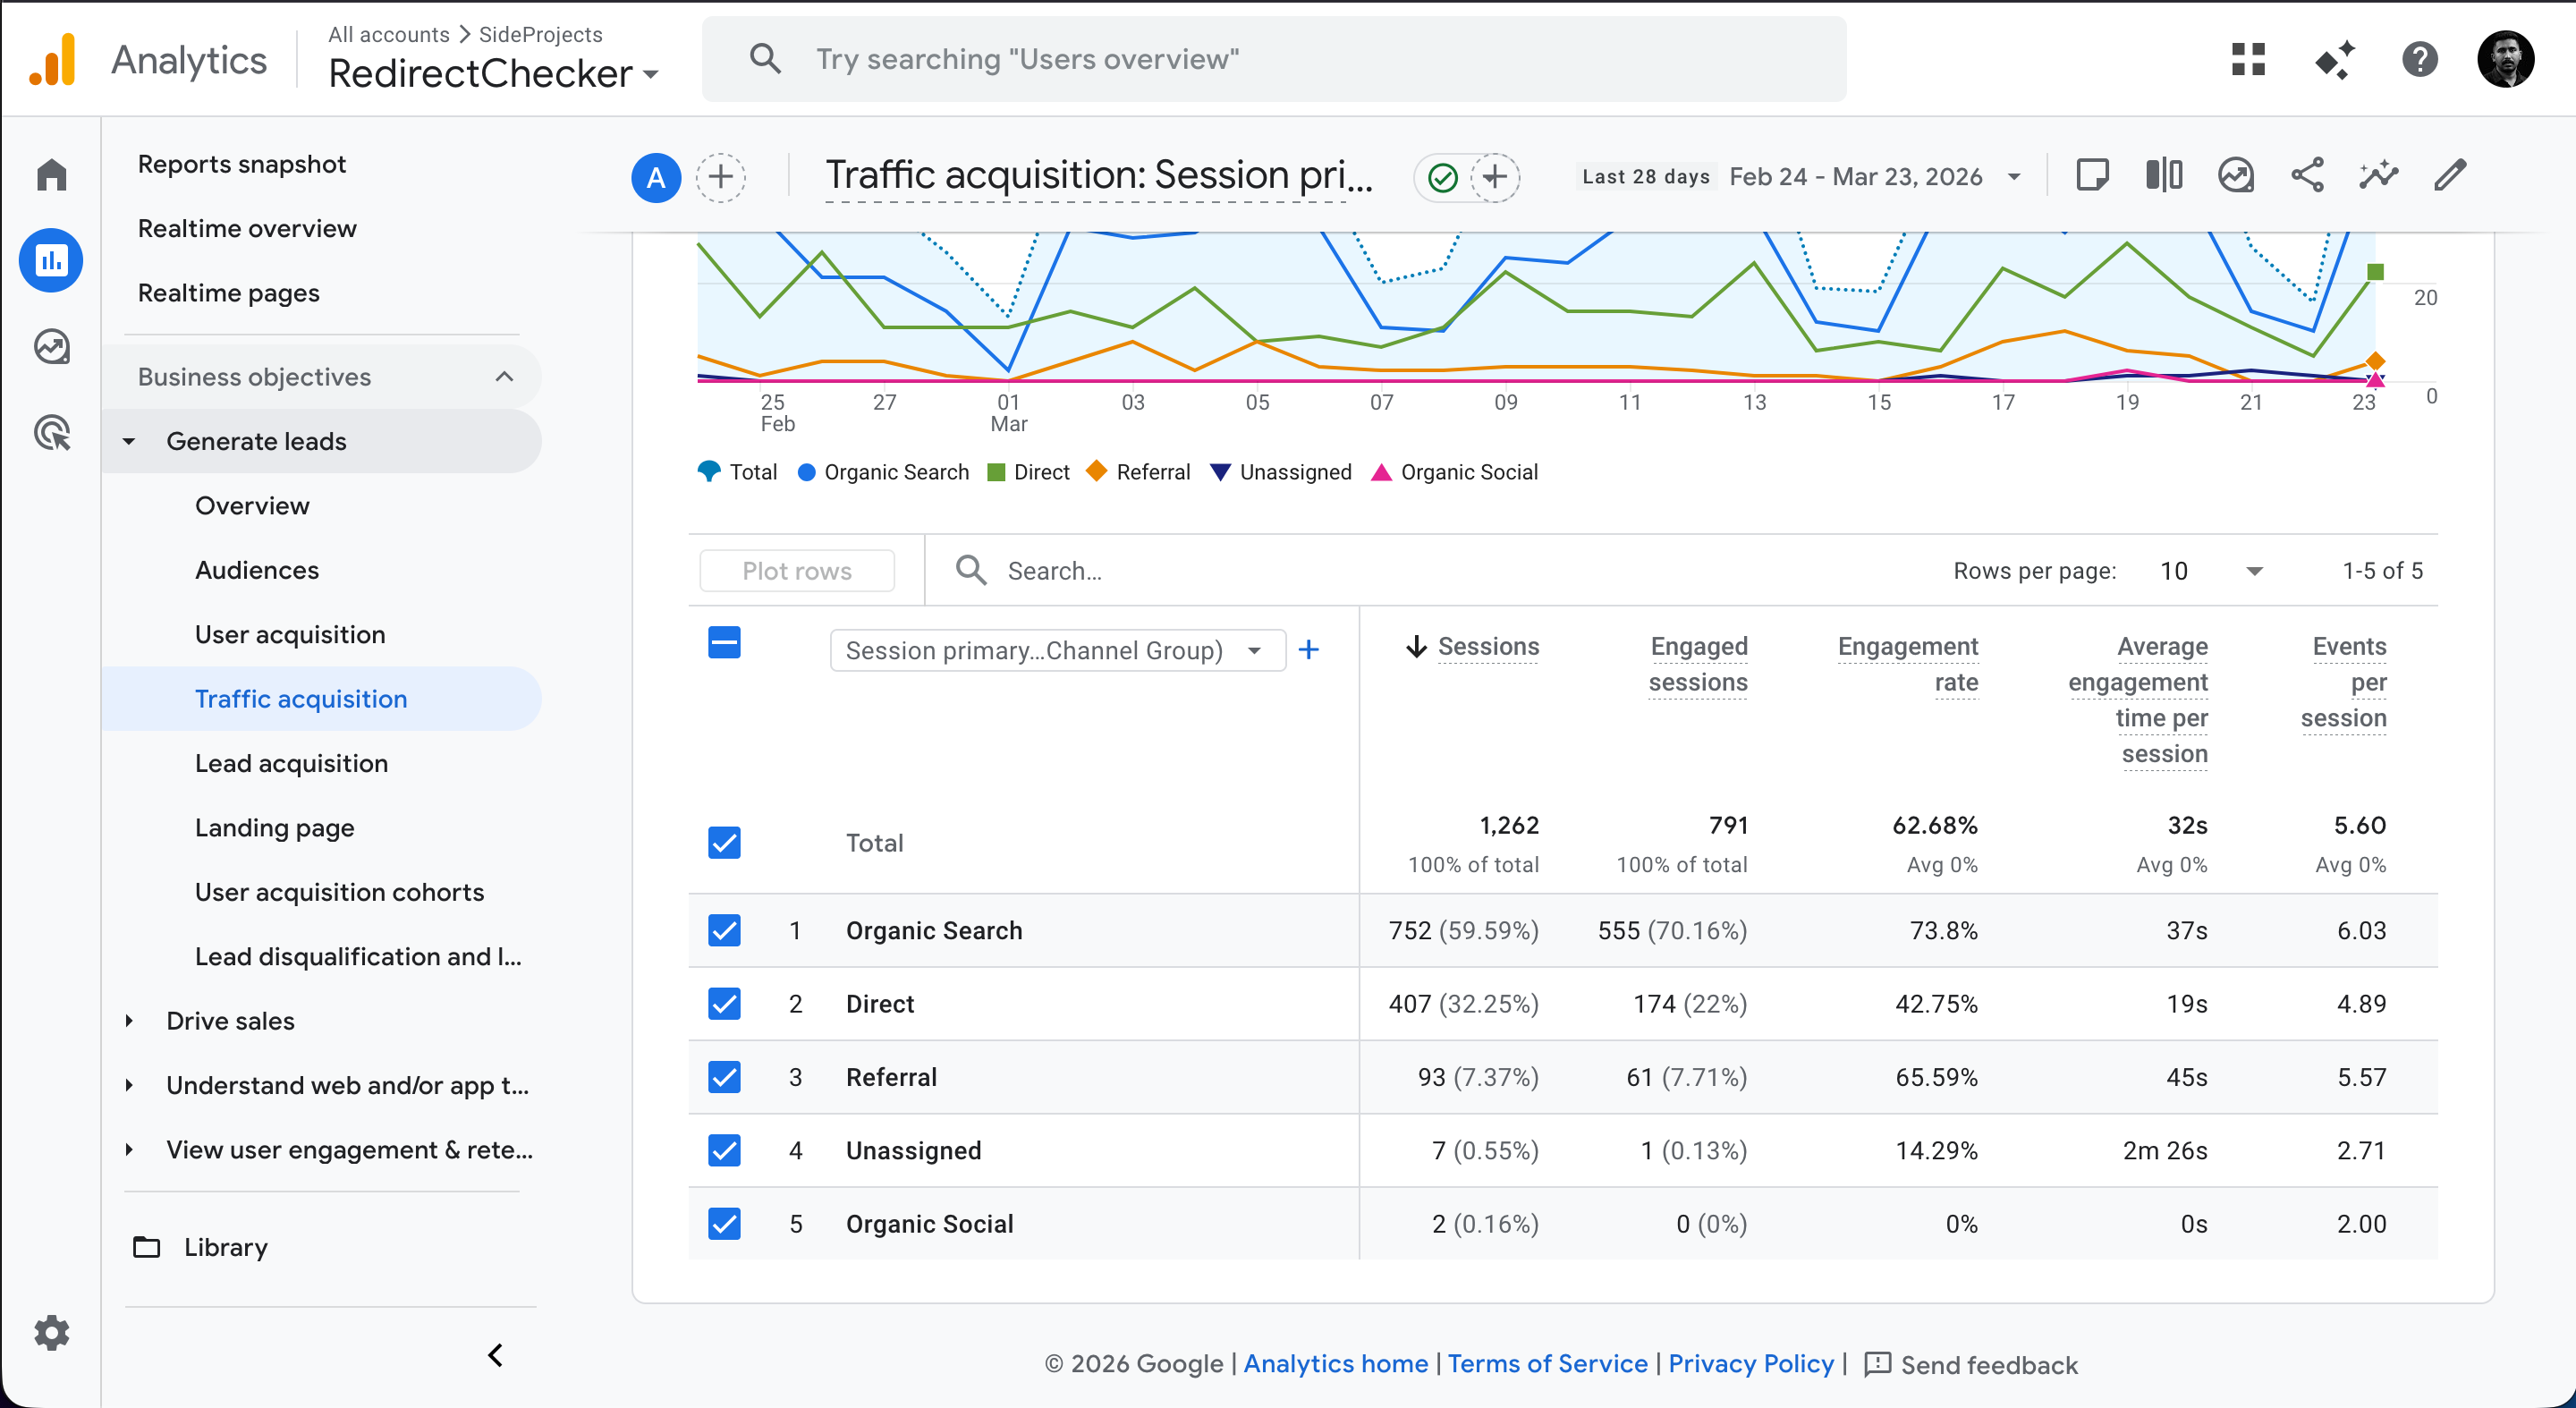
Google Analytics - RedirectChecker.io sessions growth
TL;DR
| Metric | Value |
|---|---|
| Domain | redirectchecker.io |
| Niche | SEO / Web Developer Tool |
| Primary Keyword | "redirect checker" |
| Bing Ranking | #2 |
| Monthly Sessions (Latest) | 1,000+ |
| Growth (8 months) | +119% |
| Backlinks Built | 0 |
| Content Pieces Published | 0 blog posts |
| Paid Spend | $0 |
| Bing vs Google Traffic Ratio | 14.3 : 1 |
The Background
In the final quarter of 2024, I built RedirectChecker.io - a free tool that lets you trace HTTP redirect chains, inspect status codes, and debug redirect loops. It's a utility that every SEO professional and web developer needs at some point.
The domain choice was deliberate: redirectchecker.io. An exact match domain (EMD) for the query “redirect checker.”
The Hypothesis
There's a long-standing debate in the SEO community about whether exact match domains still carry weight. Google's EMD Update (September 2012) was supposed to have killed the advantage of EMDs. And for Google, that's largely true - the algo now treats EMDs the same as branded domains.
But what about Bing?
Bing powers a much larger ecosystem than most SEOs realise: Bing Search, DuckDuckGo, Yahoo Search, Microsoft Copilot, and Ecosia all rely on Bing's index. Combined, this ecosystem handles roughly 14–16% of global search traffic.
The Data: 8 Months of Growth
Overall Traffic Growth
| Month | Sessions | Users | Page Views | Avg Session Duration | Bounce Rate |
|---|---|---|---|---|---|
| Aug 2025 | 456 | 321 | 1,187 | 3m 12s | 42% |
| Sep 2025 | 502 | 358 | 1,264 | 3m 05s | 40% |
| Oct 2025 | 548 | 392 | 1,389 | 3m 18s | 39% |
| Nov 2025 | 687 | 489 | 1,756 | 3m 22s | 38% |
| Dec 2025 | 573 | 401 | 1,421 | 3m 08s | 41% |
| Jan 2026 | 531 | 378 | 1,312 | 3m 15s | 40% |
| Feb 2026 | 998 | 712 | 2,534 | 3m 28s | 36% |
| Mar 2026 | 1,024* | 738* | 2,610* | 3m 31s | 35% |
* March 2026 data as of March 23, projected to ~1,370 sessions for the full month.
Key Milestones
- •Aug → Feb growth: +119% in sessions
- •March 2026 is on pace to be the best month ever (~1,370 projected sessions)
- •February 2026 saw a massive 88% month-over-month spike from January
- •Avg. session duration of 3+ minutes across all months - users are actively using the tool, not bouncing
Bing vs Google
This is where it gets interesting. Let's break down traffic by search engine:
Monthly Sessions by Search Engine
| Month | Bing | DuckDuckGo | ChatGPT | |
|---|---|---|---|---|
| Aug 2025 | 178 | 12 | 34 | 22 |
| Sep 2025 | 203 | 15 | 41 | 31 |
| Oct 2025 | 231 | 17 | 48 | 38 |
| Nov 2025 | 312 | 22 | 56 | 141 |
| Dec 2025 | 248 | 19 | 52 | 47 |
| Jan 2026 | 226 | 18 | 44 | 36 |
| Feb 2026 | 389 | 24 | 72 | 54 |
| Mar 2026 | 310* | 20* | 63* | 43* |
* March 2026 data as of March 23.
All-Time Source Totals
| Source | Sessions | % of Total |
|---|---|---|
| Bing | 2,097 | 72.4% |
| DuckDuckGo | 410 | 14.2% |
| 147 | 5.1% | |
| Yahoo | 144 | 5.0% |
| Copilot | 67 | 2.3% |
| Ecosia | 13 | 0.4% |
| Yandex | 11 | 0.4% |
Cracking AISEO? Rank on Bing to start with
We all knew it
ChatGPT Sessions by Month
| Month | ChatGPT Sessions |
|---|---|
| Aug 2025 | 22 |
| Sep 2025 | 31 |
| Oct 2025 | 38 |
| Nov 2025 | 141 |
| Dec 2025 | 47 |
| Jan 2026 | 36 |
| Feb 2026 | 54 |
| Mar 2026 | 43* |
* March 2026 data as of March 23.
Traffic Channel Breakdown
| Channel | Sessions | % of Total |
|---|---|---|
| Organic Search | 2,896 | 51.5% |
| Direct | 2,096 | 37.3% |
| Referral | 541 | 9.6% |
| Unassigned | 76 | 1.4% |
| Organic Social | 11 | 0.2% |
The high direct traffic percentage (37.3%) suggests users are bookmarking the tool and returning - a strong signal of product-market fit and utility.
Geographic Distribution
RedirectChecker.io attracts users from 124 countries, with a strong skew toward high-value markets:
| Country | Sessions | Users |
|---|---|---|
| United States | 1,305 | 852 |
| India | 826 | 476 |
| China | 436 | 430 |
| United Kingdom | 339 | 216 |
| Singapore | 260 | 244 |
| Germany | 180 | 150 |
| Netherlands | 146 | 116 |
| Canada | 131 | 93 |
| Australia | 127 | 79 |
| Poland | 120 | 79 |
The US, UK, Canada, and Australia alone account for 33.8% of all traffic - premium advertising markets with high CPMs if the site were to be monetised.
Device Split
| Device | Sessions | % of Total |
|---|---|---|
| Desktop | 5,151 | 93.3% |
| Mobile | 367 | 6.6% |
| Tablet | 6 | 0.1% |
The 93% desktop split makes perfect sense - this is a developer/SEO professional tool. Users are checking redirects while working, not browsing on their phones. This also means the audience is high-intent and technically sophisticated.
Key Takeaways for SEOs
1. EMDs Are Far From Dead - Especially on Bing
If your SEO strategy only considers Google, you're ignoring 15%+ of the search market. On Bing, exact match domains still provide a significant ranking advantage for utility and tool-based queries.
2. The Bing Ecosystem Is Bigger Than You Think
Bing doesn't just power Bing.com. DuckDuckGo, Yahoo, Microsoft Copilot, and Ecosia all rely on Bing's index. When you rank on Bing, you rank across an entire ecosystem. For RedirectChecker.io, this ecosystem drives 94% of all organic traffic.
What's Next
With traffic now consistently above 1,000 sessions/month and growing:
- •Start pushing for backlinks for Google
- •Content layer - adding educational content around HTTP status codes and redirect best practices could unlock Google traffic that the EMD alone can't capture